Despite many years in the energy industry, this author is continually stunned by the number of end users and energy professionals who do not understand their utility rate structures or their implications for savings potential. Unfortunately, the status quo is for an energy services firm to identify energy waste, install a solution, and then incorrectly calculate “savings” based on weighted average unit costs, in $/kWh. The reality is that weighted average unit costs can greatly over or understate the true savings opportunity.
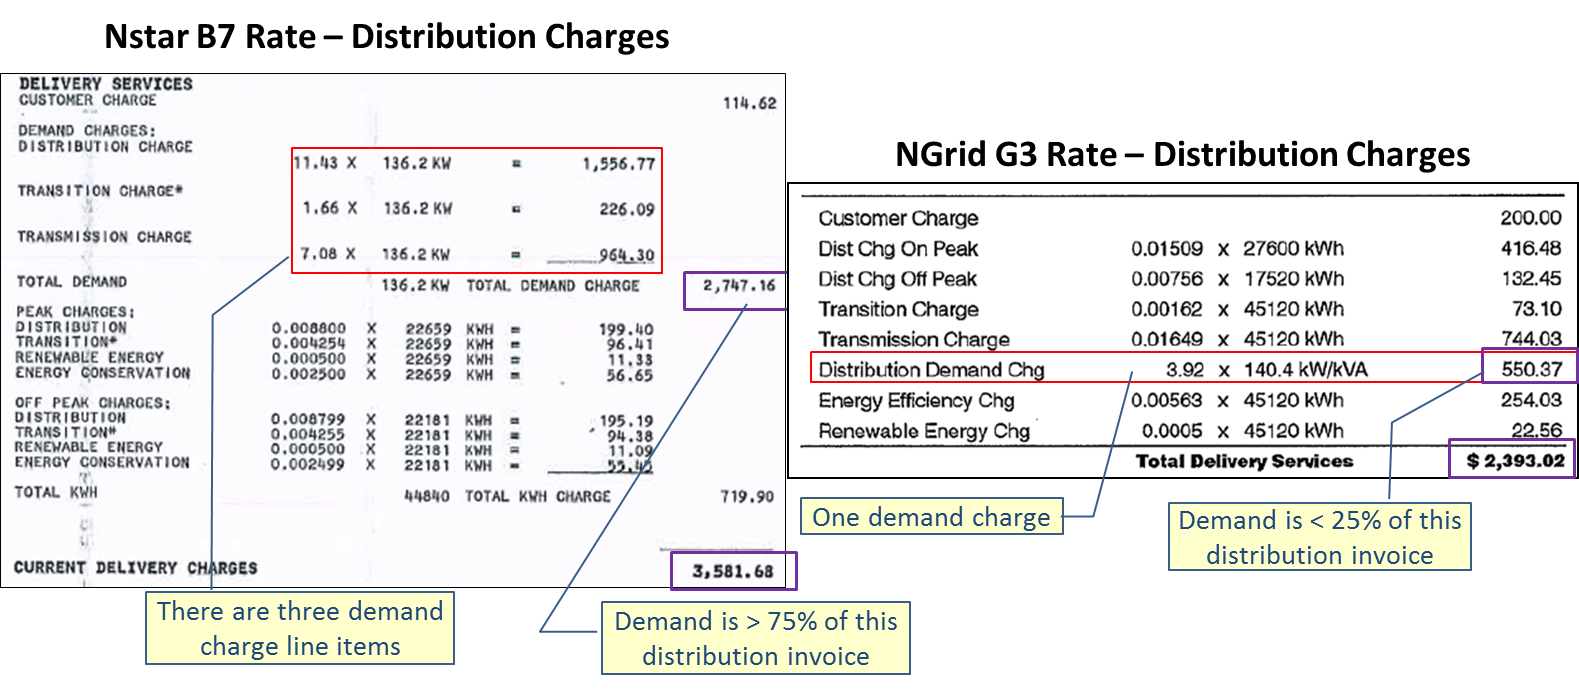
In eastern Massachusetts, the two main Investor Owned Utilities (IOUs) provide a stark contrast in rate structures for large commercial customers that have major implications for how an end user should invest in efficiency. NStar’s B7 rate is the most common rate for large commercial customers in the legacy Boston Edison service territory. It charges end users primarily based on peak demand, with particularly punishing demand charges during the summer months. National Grid’s G3 rate is the most common large commercial rate in its service territory. The G3 rate primarily charges consumers based on usage volumes in kWh. These differences are clearly evident by reviewing the invoice formats, excerpts of which are shown below.


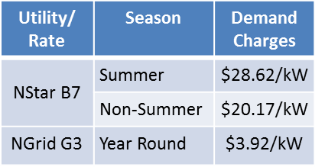
The NStar invoice on the left clearly shows the demand charges which we’ve highlighted by putting a red box around them. The purple boxes show the demand subtotal and the total distribution charges. If you look closely, you’ll see that over three fourths of this invoice consists of demand charges. Now look at the NGrid invoice to the right and you’ll see that there is just one demand charge line item. It comprises a much smaller percentage of the total distribution bill and the usage charges, billed in $/kWh, are much higher than those on the NStar bill. The blue table to the above right clearly illustrates the differences in demand charges between the two utility rates. As you can see there is nearly an order of magnitude difference between demand charges that would apply during the summer months.
In addition to the disparities in what demand costs, there are also differences in when demand is measured. Most utilities have “Peak” and “Off-peak” periods and billed demand is typically the maximum demand that occurs during the “Peak” period. If the maximum demand for a customer occurs during the “Off-peak” period, it is typically discounted so as to be much less expensive than demand measured during the “Peak” period. The graphic below shows the differences in the “Peak” periods between the two rates.

So what does this mean for the end user? First, on the NStar B7 rate, projects that reduce peak demand tend to have high ROIs. On the NGrid G-3 rate, the only effective way to reduce costs is to reduce kWh usage through efficiency. Managing peak demand has a much lower ROI on the NGrid G-3 rate since the demand charges are relatively low. The differences in peak periods are also noteworthy as NStar shortens the peak time period during the summer months. Moving the peak period start time from 8am to 9am may allow some building operators to pre-cool facilities on hot summer days or move certain demand intensive activities after 6pm.
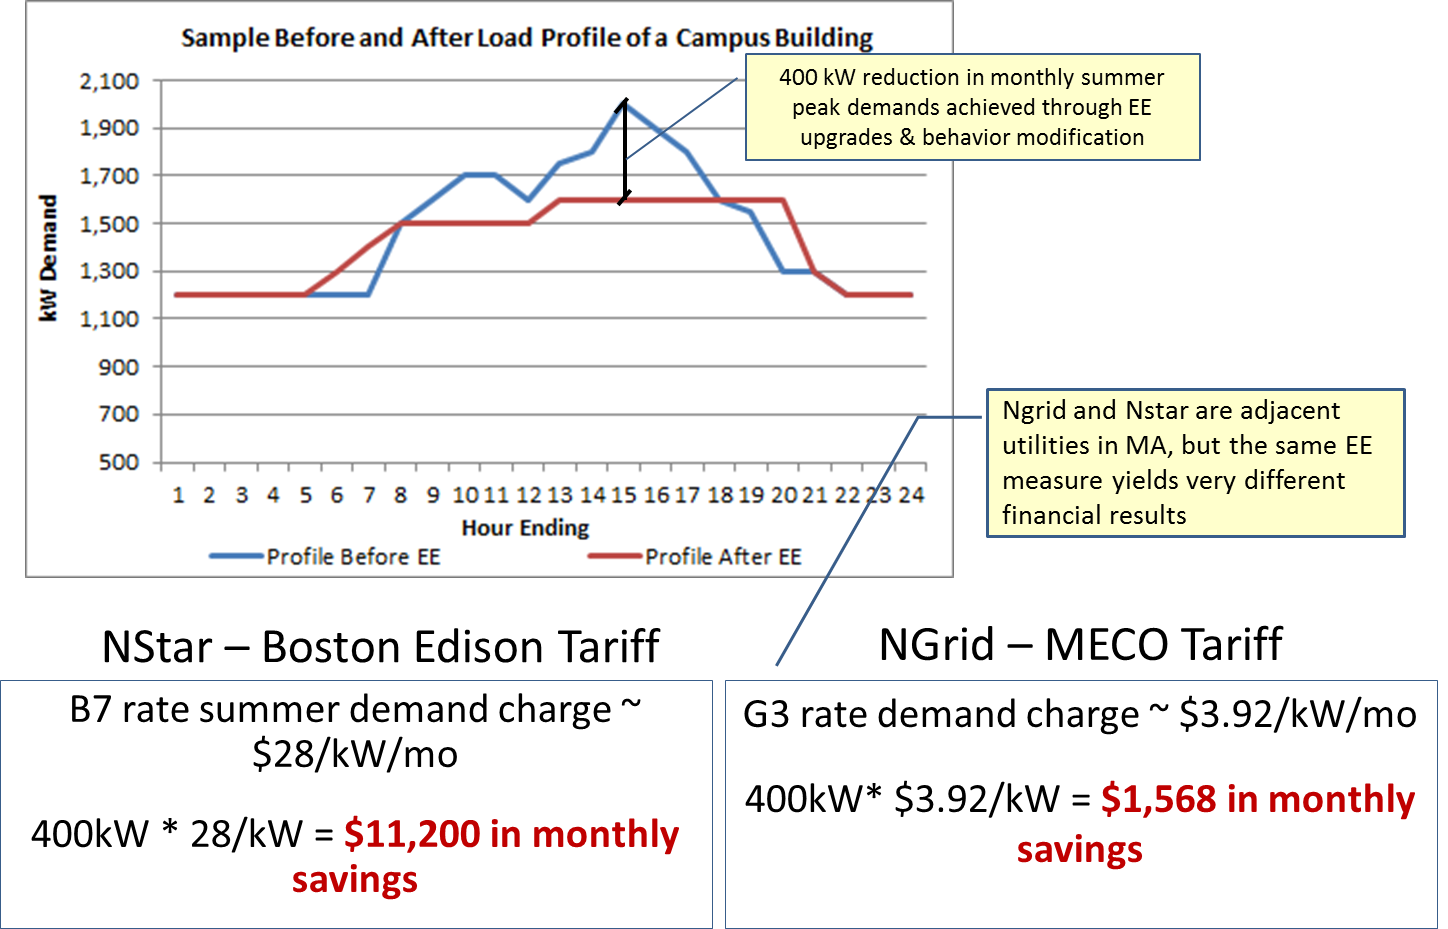
The graphic below should drive the point home pretty well. It shows the before and after load profile of a large building where EE improvements have reduced the afternoon peak (due to HVAC cooling load) in the summer months. As you can see, the EE measure yields very different financial results in the NStar B7 rate vs. the NGrid G-3 rate.

In summary, if you want to save money on your energy spend, look at your invoices first and figure out where the money is going. Energy Tariff Experts is a huge proponent of EE investment and believes EE is a critical part of any lean journey. That said, utility rates have lots of nuances in them and understanding these nuances is critical if your EE investments are going to deliver the ROIs that you require.


